Recomputing MOXSI Overlappograms#
[1]:
import sys

import astropy.units as u
import astropy.wcs
from astropy.coordinates import SkyCoord
import astropy.constants as const
import numpy as np
import matplotlib
import matplotlib.pyplot as plt
from mpl_toolkits.axes_grid1 import make_axes_locatable
import sunpy.map
from sunpy.map.maputils import extract_along_coord, contains_coordinate
from astropy.visualization import (ImageNormalize, LogStretch, SqrtStretch, AsinhStretch,
                                   AsymmetricPercentileInterval, quantity_support)
import distributed
from ndcube import NDCube

from overlappy.reproject import reproject_to_overlappogram
from overlappy.util import color_lat_lon_axes, strided_array
from overlappy.io import write_overlappogram, read_overlappogram

sys.path.append('../../')
from mocksipipeline.physics import read_spectral_cube
from mocksipipeline.detector import Channel, SpectrogramChannel, convolve_with_response
WARNING: SunpyDeprecationWarning: The `sunpy.io.fits` module is deprecated, as it was designed for internal use. Use the `astropy.fits.io` module instead for more generic functionality to read FITS files. [sunpy.io.fits]
[2]:
client = distributed.Client()
[3]:
client
[3]:
Client
Client-deab5f16-292e-11ed-ab7d-828c955afdf8
| Connection method: Cluster object | Cluster type: distributed.LocalCluster |
| Dashboard: http://127.0.0.1:8787/status |
Cluster Info
LocalCluster
95225d70
| Dashboard: http://127.0.0.1:8787/status | Workers: 5 |
| Total threads: 10 | Total memory: 64.00 GiB |
| Status: running | Using processes: True |
Scheduler Info
Scheduler
Scheduler-e9da9c63-db3a-4cea-ba8a-8edb1d42f063
| Comm: tcp://127.0.0.1:57200 | Workers: 5 |
| Dashboard: http://127.0.0.1:8787/status | Total threads: 10 |
| Started: Just now | Total memory: 64.00 GiB |
Workers
Worker: 0
| Comm: tcp://127.0.0.1:57225 | Total threads: 2 |
| Dashboard: http://127.0.0.1:57228/status | Memory: 12.80 GiB |
| Nanny: tcp://127.0.0.1:57205 | |
| Local directory: /var/folders/cr/pj7yk8p976d7ny98bgvlpfyr0000gq/T/dask-worker-space/worker-x70h55os | |
Worker: 1
| Comm: tcp://127.0.0.1:57219 | Total threads: 2 |
| Dashboard: http://127.0.0.1:57221/status | Memory: 12.80 GiB |
| Nanny: tcp://127.0.0.1:57207 | |
| Local directory: /var/folders/cr/pj7yk8p976d7ny98bgvlpfyr0000gq/T/dask-worker-space/worker-upkr1eyc | |
Worker: 2
| Comm: tcp://127.0.0.1:57224 | Total threads: 2 |
| Dashboard: http://127.0.0.1:57226/status | Memory: 12.80 GiB |
| Nanny: tcp://127.0.0.1:57204 | |
| Local directory: /var/folders/cr/pj7yk8p976d7ny98bgvlpfyr0000gq/T/dask-worker-space/worker-iar27lyr | |
Worker: 3
| Comm: tcp://127.0.0.1:57218 | Total threads: 2 |
| Dashboard: http://127.0.0.1:57220/status | Memory: 12.80 GiB |
| Nanny: tcp://127.0.0.1:57203 | |
| Local directory: /var/folders/cr/pj7yk8p976d7ny98bgvlpfyr0000gq/T/dask-worker-space/worker-keirv0b2 | |
Worker: 4
| Comm: tcp://127.0.0.1:57230 | Total threads: 2 |
| Dashboard: http://127.0.0.1:57231/status | Memory: 12.80 GiB |
| Nanny: tcp://127.0.0.1:57206 | |
| Local directory: /var/folders/cr/pj7yk8p976d7ny98bgvlpfyr0000gq/T/dask-worker-space/worker-um5uh470 | |
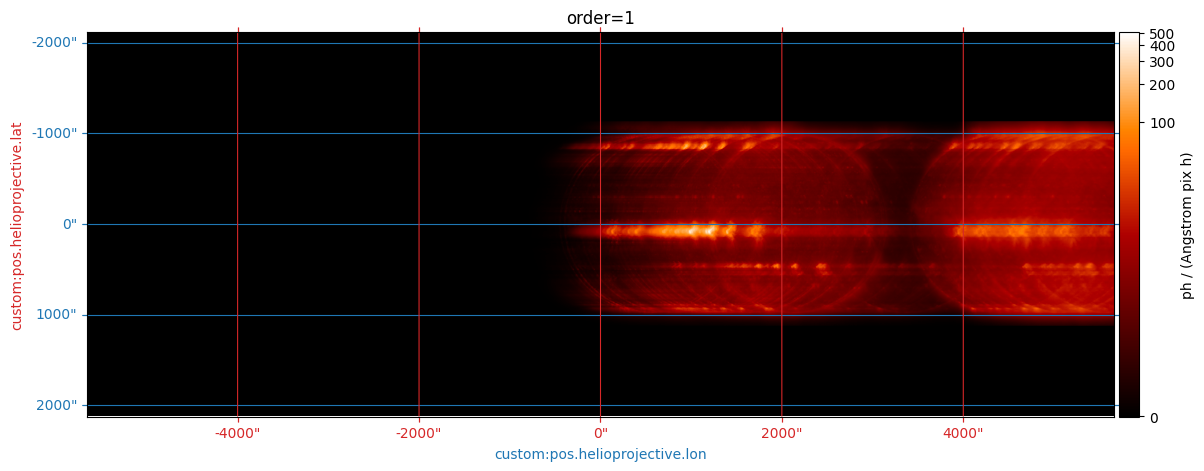
In this notebook, I’m just recomputing the MOXSI overlappogram for the AR case, but this time, I’m not including the gain calculation such that the units of the overlappogram will be in photons rather than DN.
[4]:
spectral_cube = read_spectral_cube('moxsi-spectral-cube-ar.fits',hdu=1)
[5]:
observer = astropy.wcs.utils.wcs_to_celestial_frame(spectral_cube.wcs).observer
[6]:
observer
[6]:
<HeliographicStonyhurst Coordinate (obstime=2020-11-09T18:00:06.640, rsun=696000.0 km): (lon, lat, radius) in (deg, deg, m)
    (0.006005, 3.43378555, 1.48126201e+11)>
[7]:
order = 1
chan = SpectrogramChannel(order, '../../mocksipipeline/data/MOXSI_effarea.genx')
instr_cube = convolve_with_response(spectral_cube, chan, include_gain=False)
overlap = reproject_to_overlappogram(
    instr_cube,
    chan.detector_shape,
    observer=observer,
    reference_pixel=(
        (chan.detector_shape[1] + 1)/2,
        (chan.detector_shape[0] + 1)/2,
        1,
    ) * u.pix,
    reference_coord=(
        0 * u.arcsec,
        0 * u.arcsec,
        instr_cube.axis_world_coords(0)[0].to('angstrom')[0],
    ),
    scale=(
        chan.resolution[0],
        chan.resolution[1],
        chan.spectral_resolution,
    ),
    roll_angle=-90*u.deg,
    dispersion_angle=0*u.deg,
    dispersion_axis=0,
    order=chan.spectral_order,
    meta_keys=['CHANNAME'],
    use_dask=True,
    sum_over_lambda=True,
    algorithm='interpolation',
)
WARNING: FITSFixedWarning: 'datfix' made the change 'Set MJD-OBS to 59162.750077 from DATE-OBS'. [astropy.wcs.wcs]
WARNING: No observer defined on WCS, SpectralCoord will be converted without any velocity frame change [astropy.wcs.wcsapi.fitswcs]
WARNING: No observer defined on WCS, SpectralCoord will be converted without any velocity frame change [astropy.wcs.wcsapi.fitswcs]
WARNING: No observer defined on WCS, SpectralCoord will be converted without any velocity frame change [astropy.wcs.wcsapi.fitswcs]
WARNING: No observer defined on WCS, SpectralCoord will be converted without any velocity frame change [astropy.wcs.wcsapi.fitswcs]
WARNING: No observer defined on WCS, SpectralCoord will be converted without any velocity frame change [astropy.wcs.wcsapi.fitswcs]
[10]:
fig = plt.figure(figsize=(15,5))
wave_index = 0
ax = fig.add_subplot(111, projection=overlap[wave_index].wcs)
plot_unit = 'ph / (Angstrom pix h)'
#vmin, vmax = AsymmetricPercentileInterval(1,99.5).get_limits(
#    u.Quantity(total_overlap[wave_index].data, total_overlap.unit).to_value(plot_unit),
#)
overlap[wave_index].plot(
    axes=ax,
    cmap='hinodexrt',
    norm=ImageNormalize(stretch=LogStretch()),
    data_unit=plot_unit
)
im = ax.get_images()[0]
divider = make_axes_locatable(ax)
cax = divider.append_axes('right', size='2%', pad=0.05, axes_class=matplotlib.axes.Axes)
cbar = fig.colorbar(im, cax=cax, orientation='vertical')
cax.yaxis.set_ticks_position("right")
cbar.set_label(f'{plot_unit}',)
color_lat_lon_axes(ax)
ax.set_title(f'order={order}')
[10]:
Text(0.5, 1.0, 'order=1')
[18]:
overlappogram_components = {}
spectral_orders = [-3, -1, 0, 1, 3]
for order in spectral_orders:
    print(f'Computing overlap for order={order}')
    chan = SpectrogramChannel(order, '../../mocksipipeline/data/MOXSI_effarea.genx')
    instr_cube = convolve_with_response(spectral_cube, chan, include_gain=False)
    overlap = reproject_to_overlappogram(
        instr_cube,
        chan.detector_shape,
        observer=observer,
        reference_pixel=(
            (chan.detector_shape[1] + 1)/2,
            (chan.detector_shape[0] + 1)/2,
            1,
        ) * u.pix,
        reference_coord=(
            0 * u.arcsec,
            0 * u.arcsec,
            instr_cube.axis_world_coords(0)[0].to('angstrom')[0],
        ),
        scale=(
            chan.resolution[0],
            chan.resolution[1],
            chan.spectral_resolution,
        ),
        roll_angle=-90*u.deg,
        dispersion_angle=0*u.deg,
        dispersion_axis=0,
        order=chan.spectral_order,
        meta_keys=['CHANNAME'],
        use_dask=True,
        sum_over_lambda=True,
        algorithm='interpolation',
    )
    write_overlappogram(overlap, f'overlappogram-ar-photons-order={order}.fits')
    overlappogram_components[order] = overlap
Computing overlap for order=-3
WARNING: FITSFixedWarning: 'datfix' made the change 'Set MJD-OBS to 59162.750077 from DATE-OBS'. [astropy.wcs.wcs]
Computing overlap for order=-1
WARNING: FITSFixedWarning: 'datfix' made the change 'Set MJD-OBS to 59162.750077 from DATE-OBS'. [astropy.wcs.wcs]
Computing overlap for order=0
WARNING: FITSFixedWarning: 'datfix' made the change 'Set MJD-OBS to 59162.750077 from DATE-OBS'. [astropy.wcs.wcs]
2022-08-31 10:18:37,793 - distributed.worker_memory - WARNING - gc.collect() took 3.328s. This is usually a sign that some tasks handle too many Python objects at the same time. Rechunking the work into smaller tasks might help.
Computing overlap for order=1
WARNING: FITSFixedWarning: 'datfix' made the change 'Set MJD-OBS to 59162.750077 from DATE-OBS'. [astropy.wcs.wcs]
Computing overlap for order=3
WARNING: FITSFixedWarning: 'datfix' made the change 'Set MJD-OBS to 59162.750077 from DATE-OBS'. [astropy.wcs.wcs]
2022-08-31 10:32:46,633 - distributed.worker_memory - WARNING - gc.collect() took 4.476s. This is usually a sign that some tasks handle too many Python objects at the same time. Rechunking the work into smaller tasks might help.
[4]:
overlappogram_components = {
    -3: read_overlappogram('overlappogram-ar-photons-order=-3.fits'),
    -1: read_overlappogram('overlappogram-ar-photons-order=-1.fits'),
    0: read_overlappogram('overlappogram-ar-photons-order=0.fits'),
    1: read_overlappogram('overlappogram-ar-photons-order=1.fits'),
    3: read_overlappogram('overlappogram-ar-photons-order=3.fits'),
}
[5]:
def get_full_overlappogram(components, order):
    data = np.array([components[k].data[0] for k in components]).sum(axis=0)
    wcs = components[order].wcs
    data_strided = strided_array(data, components[order].data.shape[0])
    return NDCube(data_strided, wcs=wcs, unit=components[order].unit, meta=components[order].meta)
[6]:
total_overlap = get_full_overlappogram(overlappogram_components, 0)
[7]:
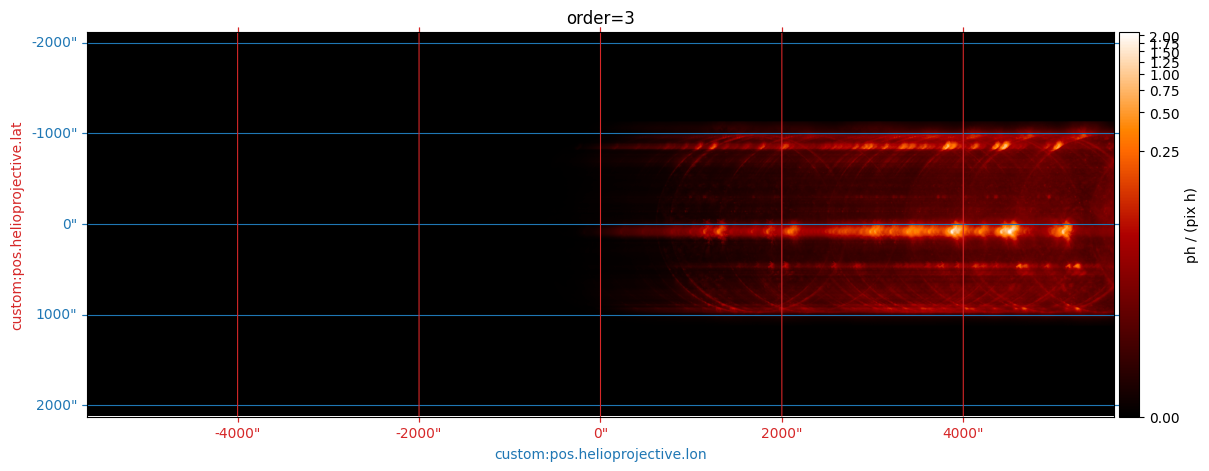
for k,v in overlappogram_components.items():
    fig = plt.figure(figsize=(15,5))
    wave_index = 0
    ax = fig.add_subplot(111, projection=v[wave_index].wcs)
    plot_unit = 'ph / (pix h)'
    #vmin, vmax = AsymmetricPercentileInterval(1,99.5).get_limits(
    #    u.Quantity(total_overlap[wave_index].data, total_overlap.unit).to_value(plot_unit),
    #)
    v[wave_index].plot(
        axes=ax,
        cmap='hinodexrt',
        norm=ImageNormalize(stretch=LogStretch()),
        data_unit=plot_unit
    )
    im = ax.get_images()[0]
    divider = make_axes_locatable(ax)
    cax = divider.append_axes('right', size='2%', pad=0.05, axes_class=matplotlib.axes.Axes)
    cbar = fig.colorbar(im, cax=cax, orientation='vertical')
    cax.yaxis.set_ticks_position("right")
    cbar.set_label(f'{plot_unit}',)
    color_lat_lon_axes(ax)
    ax.set_title(f'order={k}')


[8]:
hpc_frame = astropy.wcs.utils.wcs_to_celestial_frame(total_overlap.wcs)
endpoints = SkyCoord(Tx=([100,100]*u.arcsec), Ty=([-5600,5600]*u.arcsec), frame=hpc_frame)
lower = SkyCoord(Tx=[275,275]*u.arcsec,Ty=[-650,5600]*u.arcsec,frame=hpc_frame)
upper = SkyCoord(Tx=[-150,-150]*u.arcsec,Ty=[-650,5600]*u.arcsec,frame=hpc_frame)
blc = SkyCoord(Tx=-150*u.arcsec,Ty=-650*u.arcsec,frame=hpc_frame)
trc = SkyCoord(Tx=275*u.arcsec, Ty=5600*u.arcsec,frame=hpc_frame)
[168]:
fig = plt.figure(figsize=(15,5))
wave_index = 0
ax = fig.add_subplot(111, projection=total_overlap[wave_index].wcs)
plot_unit = 'ph / (pix h)'
#vmin, vmax = AsymmetricPercentileInterval(1,99.5).get_limits(
#    u.Quantity(total_overlap[wave_index].data, total_overlap.unit).to_value(plot_unit),
#)
total_overlap[wave_index].plot(
    axes=ax,
    cmap='hinodexrt',
    norm=ImageNormalize(vmax=200,stretch=LogStretch()),
    data_unit=plot_unit
)
ax.plot_coord(lower, ls='--', color='w', lw=2)
ax.plot_coord(upper, ls='--', color='w', lw=2)
im = ax.get_images()[0]
divider = make_axes_locatable(ax)
cax = divider.append_axes('right', size='2%', pad=0.05, axes_class=matplotlib.axes.Axes)
cbar = fig.colorbar(im, cax=cax, orientation='vertical')
cax.yaxis.set_ticks_position("right")
cbar.set_label(f'{plot_unit}',)
color_lat_lon_axes(ax)
ax.set_title('All orders')
#fig.savefig('overlap-all-orders.png')
[168]:
Text(0.5, 1.0, 'All orders')

[10]:
row_lower, col_lower = total_overlap[0].wcs.world_to_array_index(lower)
row_upper, col_upper = total_overlap[0].wcs.world_to_array_index(upper)
[94]:
fig = plt.figure(figsize=(15, 5))

# Order=0
cropped_slice = overlappogram_components[0][0].crop(blc, trc)
ax = fig.add_subplot(4,1,1, projection=cropped_slice.wcs)
cropped_slice.plot(axes=ax,
                   cmap='hinodexrt',
                   data_unit='ph pix-1 h-1',
                   norm=ImageNormalize(stretch=LogStretch()))
im = ax.get_images()[0]
divider = make_axes_locatable(ax)
cax = divider.append_axes('right', size='1%', pad=0.05, axes_class=matplotlib.axes.Axes)
cbar = fig.colorbar(im, cax=cax, orientation='vertical')
cax.yaxis.set_ticks_position("right")
ax.text((0*u.arcsec).to('deg').value,
        (3000*u.arcsec).to('deg').value,
        'order=0',
        transform=ax.get_transform('world'),
        horizontalalignment='center',
        verticalalignment='center',
        color='w')

# Order=1
cropped_slice = overlappogram_components[1][0].crop(blc, trc)
ax = fig.add_subplot(4,1,2, projection=cropped_slice.wcs)
cropped_slice.plot(axes=ax,
                   cmap='hinodexrt',
                   data_unit='ph pix-1 h-1',
                   norm=ImageNormalize(stretch=LogStretch()))
im = ax.get_images()[0]
divider = make_axes_locatable(ax)
cax = divider.append_axes('right', size='1%', pad=0.05, axes_class=matplotlib.axes.Axes)
cbar = fig.colorbar(im, cax=cax, orientation='vertical')
cax.yaxis.set_ticks_position("right")
ax.text((0*u.arcsec).to('deg').value,
        (-100*u.arcsec).to('deg').value,
        'order=1',
        transform=ax.get_transform('world'),
        horizontalalignment='center',
        verticalalignment='center',
        color='w')

# Order=3
cropped_slice = overlappogram_components[3][0].crop(blc, trc)
ax = fig.add_subplot(4,1,3, projection=cropped_slice.wcs)
cropped_slice.plot(axes=ax,
                   cmap='hinodexrt',
                   data_unit='ph pix-1 h-1',
                   norm=ImageNormalize(stretch=LogStretch()))
im = ax.get_images()[0]
divider = make_axes_locatable(ax)
cax = divider.append_axes('right', size='1%', pad=0.05, axes_class=matplotlib.axes.Axes)
cbar = fig.colorbar(im, cax=cax, orientation='vertical')
cax.yaxis.set_ticks_position("right")
ax.text((0*u.arcsec).to('deg').value,
        (-100*u.arcsec).to('deg').value,
        'order=3',
        transform=ax.get_transform('world'),
        horizontalalignment='center',
        verticalalignment='center',
        color='w')

# Total
cropped_slice = total_overlap[0].crop(blc, trc)
ax = fig.add_subplot(4,1,4, projection=cropped_slice.wcs)
cropped_slice.plot(axes=ax,
                   cmap='hinodexrt',
                   data_unit='ph pix-1 h-1',
                   norm=ImageNormalize(stretch=LogStretch()))
im = ax.get_images()[0]
divider = make_axes_locatable(ax)
cax = divider.append_axes('right', size='1%', pad=0.05, axes_class=matplotlib.axes.Axes)
cbar = fig.colorbar(im, cax=cax, orientation='vertical')
cax.yaxis.set_ticks_position("right")
color_lat_lon_axes(ax,)
ax.coords[0].grid(alpha=0)
ax.coords[1].grid(alpha=0)
ax.text((0*u.arcsec).to('deg').value,
        (3000*u.arcsec).to('deg').value,
        'All orders',
        transform=ax.get_transform('world'),
        horizontalalignment='center',
        verticalalignment='center',
        color='w')
#fig.savefig('overlap-components-cutout.png')
[94]:
Text(0.0, 0.8333333333333334, 'All orders')

[149]:
intensity_total_sum = u.Quantity(cropped_slice.data.sum(axis=0), cropped_slice.unit)
pix_coords = np.linspace(0, cropped_slice.data.shape[1]-1, cropped_slice.data.shape[1])
cropped_coords = cropped_slice.wcs.pixel_to_world(pix_coords, 0)
cropped_coords_diff = cropped_coords.separation(cropped_coords[0]).to('arcsec')
[150]:
intensity_order0_sum = u.Quantity(overlappogram_components[0][0].crop(blc, trc).data.sum(axis=0),
                                  cropped_slice.unit)
intensity_order1_sum = u.Quantity(overlappogram_components[1][0].crop(blc, trc).data.sum(axis=0),
                                  cropped_slice.unit)
intensity_order3_sum = u.Quantity(overlappogram_components[3][0].crop(blc, trc).data.sum(axis=0),
                                  cropped_slice.unit)
[112]:
with quantity_support():
    plt.plot(cropped_coords.Ty, intensity_total_sum.to('ph h-1'), label='total', color='k')
    plt.plot(cropped_coords.Ty, intensity_order0_sum.to('ph h-1'), label='order=0', ls='--')
    plt.plot(cropped_coords.Ty, intensity_order1_sum.to('ph h-1'), label='order=1', ls='--')
    plt.plot(cropped_coords.Ty, intensity_order3_sum.to('ph h-1'), label='order=3', ls='--')
    #plt.axhline(y=1*u.Unit('ph h-1'), ls=':', lw=1, color='k')
plt.yscale('log')
plt.ylabel('Summed intensity \n [ph / h / spatial pixel in the dispersion direction]')
plt.xlabel('HPC Latitude [arcsec]')
plt.legend(loc=1,ncol=2,frameon=False)
plt.ylim(1e-1, 1e4)
plt.xlim(cropped_coords.Ty[[0,-1]].to_value('arcsec'))
[112]:
(-648.0672935647827, 5599.189314101428)

[151]:
wavelengths = total_overlap.axis_world_coords(0)[0]
[152]:
total_overlap_o1 = get_full_overlappogram(overlappogram_components, 1)
[153]:
px_cutout, py_cutout, _ = total_overlap_o1.wcs.world_to_pixel(cropped_coords, wavelengths[0])
WARNING: No observer defined on WCS, SpectralCoord will be converted without any velocity frame change [astropy.wcs.wcsapi.fitswcs]
[154]:
_, wave_locs_o1 = total_overlap_o1.wcs.pixel_to_world(px_cutout,
                                                    py_cutout,
                                                    np.linspace(0,px_cutout.shape[0]-1, px_cutout.shape[0]))
[155]:
wave_locs_o1
[155]:
$[1.0549999 \times 10^{-10},~1.1099999 \times 10^{-10},~1.1649999 \times 10^{-10},~\dots,~6.1665 \times 10^{-9},~6.172 \times 10^{-9},~6.1775 \times 10^{-9}] \; \mathrm{m}$
[156]:
chan_o1 = SpectrogramChannel(1, '../../mocksipipeline/data/MOXSI_effarea.genx')
[157]:
intensity_order0_sum / chan_o1.spectral_resolution
[157]:
$[1.5389696,~1.5731026,~1.6382059,~\dots,~0,~0,~0] \; \mathrm{\frac{ph}{\mathring{A}\,s}}$
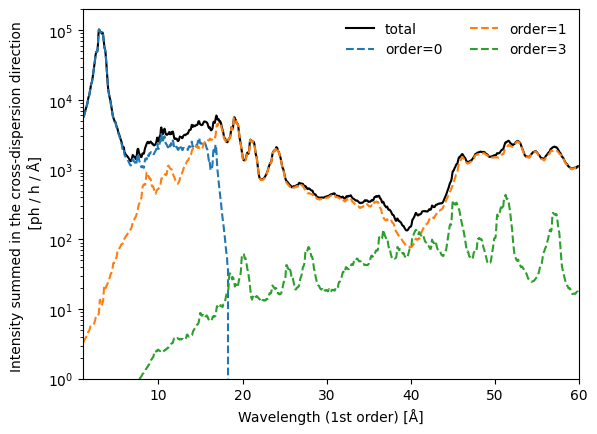
[170]:
#fig = plt.figure(figsize=(10,6))
with quantity_support():
    plt.plot(wave_locs_o1.to('Angstrom'),
             (intensity_total_sum / chan_o1.spectral_resolution).to('ph h-1 Angstrom-1'),
             label='total', color='k')
    plt.plot(wave_locs_o1, (intensity_order0_sum / chan_o1.spectral_resolution).to('ph h-1 Angstrom-1'),
             label='order=0', ls='--')
    plt.plot(wave_locs_o1, (intensity_order1_sum / chan_o1.spectral_resolution).to('ph h-1 Angstrom-1'),
             label='order=1', ls='--')
    plt.plot(wave_locs_o1, (intensity_order3_sum / chan_o1.spectral_resolution).to('ph h-1 Angstrom-1'),
             label='order=3', ls='--')
    #plt.axhline(y=1*u.Unit('ph h-1'), ls=':', lw=1, color='k')
plt.yscale('log')
plt.ylabel('Intensity summed in the cross-dispersion direction \n [ph / h / Å]')
plt.xlabel('Wavelength (1st order) [Å]')
plt.legend(loc=1,ncol=2,frameon=False)
plt.ylim(1, 2e5)
plt.xlim(wavelengths[[0,-1]].to_value('Angstrom'))
[170]:
(1.0549999475478997, 60.01499994754789)
Sandbox#
[21]:
intensity, coord = extract_along_coord(total_overlap[0],endpoints)
[23]:
plt.plot(coord.Ty, intensity.to('ph / (pix h)'))
plt.yscale('log')

[84]:
chan = SpectrogramChannel(0, '../../mocksipipeline/data/MOXSI_effarea.genx')
instr_cube = convolve_with_response(spectral_cube, chan, include_gain=False,)
[86]:
instr_cube = NDCube(instr_cube.data*chan.spectral_resolution.to_value(),
                    wcs=instr_cube.wcs,
                    meta=instr_cube.meta,
                    unit=instr_cube.unit * chan.spectral_resolution.unit * u.pix)
[87]:
wave_index = 500
print(instr_cube.axis_world_coords(0)[0][wave_index].to('angstrom'))
print((const.h * const.c / instr_cube.axis_world_coords(0)[0][wave_index].to('angstrom')).to('keV'))
fig = plt.figure()
ax = fig.add_subplot(111,projection=instr_cube[wave_index].wcs)
instr_cube[wave_index].plot(axes=ax,
                     cmap='hinodexrt',
                     norm=ImageNormalize(stretch=LogStretch()),
                     data_unit='ph / (pix h)'
                    )
color_lat_lon_axes(ax)
plt.colorbar()
28.554973721504407 Angstrom
0.434194755850289 keV
[87]:
<matplotlib.colorbar.Colorbar at 0x169339bb0>

[105]:
trc.Tx - blc.Tx
[105]:
$425\mathrm{{}^{\prime\prime}}$
[101]:
cropped_slice.wcs.pixel_to_world(0,0)
[101]:
<SkyCoord (Helioprojective: obstime=2020-11-09T18:00:06.640, rsun=695700.0 km, observer=<HeliographicStonyhurst Coordinate (obstime=2020-11-09T18:00:06.640, rsun=695700.0 km): (lon, lat, radius) in (deg, deg, m)
    (0.006005, 3.43378555, 1.48126201e+11)>): (Tx, Ty) in arcsec
    (274.50983793, -648.06729356)>
[104]:
cropped_slice.wcs.pixel_to_world(cropped_slice.dimensions[1].value-1,
                                 cropped_slice.dimensions[0].value-1)
[104]:
<SkyCoord (Helioprojective: obstime=2020-11-09T18:00:06.640, rsun=695700.0 km, observer=<HeliographicStonyhurst Coordinate (obstime=2020-11-09T18:00:06.640, rsun=695700.0 km): (lon, lat, radius) in (deg, deg, m)
    (0.006005, 3.43378555, 1.48126201e+11)>): (Tx, Ty) in arcsec
    (-149.98997356, 5599.19279065)>
[ ]: