Constructing a WCS for Overlappogram Data#
[2]:
import numpy as np
import astropy.units as u
import astropy.io.fits
from scipy.io import readsav
import sys
import matplotlib.pyplot as plt
from astropy.visualization import ImageNormalize,LogStretch
import sunpy.map
from sunpy.coordinates import get_earth
sys.path.append('../scripts')
from util import (make_moxsi_ndcube,
                  construct_overlappogram,
                  color_lat_lon_axes)
from overlappy.wc
[3]:
norm=ImageNormalize(vmin=0,vmax=10,stretch=LogStretch())
cmap='hinodexrt'
plot_props = {'cmap':cmap, 'norm':norm}
Loading Data#
First, load the data into a spectral cube, where each slice represents a different wavelength.
[4]:
savdata = readsav('../data/forDan_MOXSI_DATA_09112020_0440_feldman.sav')
[9]:
savdata.keys()
[9]:
dict_keys(['moxsi1_img', 'cubixss_wave'])
[5]:
_moxsi_cube = make_moxsi_ndcube(savdata['moxsi1_img'],savdata['cubixss_wave']*u.angstrom)
[7]:
_moxsi_cube
[7]:
<ndcube.ndcube.NDCube object at 0x7fc5f07f1f10>
NDCube
------
Dimensions: [1073.  350.  350.] pix
Physical Types of Axes: [('em.wl',), ('custom:pos.helioprojective.lon', 'custom:pos.helioprojective.lat'), ('custom:pos.helioprojective.lon', 'custom:pos.helioprojective.lat')]
Unit: ph / (pix s)
Data Type: >f8
[5]:
plt.figure(figsize=(3,8))
ax = _moxsi_cube[327].plot(norm=ImageNormalize(vmin=0,vmax=1,stretch=LogStretch()))
lon,lat = ax.coords
lon.grid(color='white', alpha=1, linestyle='solid', lw=.5,)
lat.grid(color='white', alpha=1, linestyle='solid', lw=.5,)
WARNING: target cannot be converted to ICRS, so will not be set on SpectralCoord [astropy.wcs.wcsapi.fitswcs]
WARNING: target cannot be converted to ICRS, so will not be set on SpectralCoord [astropy.wcs.wcsapi.fitswcs]
WARNING: target cannot be converted to ICRS, so will not be set on SpectralCoord [astropy.wcs.wcsapi.fitswcs]
WARNING: target cannot be converted to ICRS, so will not be set on SpectralCoord [astropy.wcs.wcsapi.fitswcs]
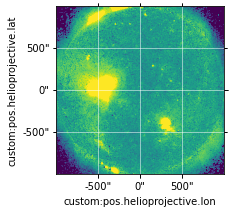
Make the cube sparse here by only including a few wavelengths and filling everything else with 0. This reduces our need to rotate/shift a bunch of arrays
[6]:
iw_rank = _moxsi_cube.data.mean(axis=(1,2)).argsort()[::-1]
new_data = np.zeros(_moxsi_cube.data.shape)
for i in iw_rank[:20]:
    new_data[i,:,:] = _moxsi_cube.data[i,:,:]
moxsi_cube = make_moxsi_ndcube(new_data, savdata['cubixss_wave']*u.angstrom)
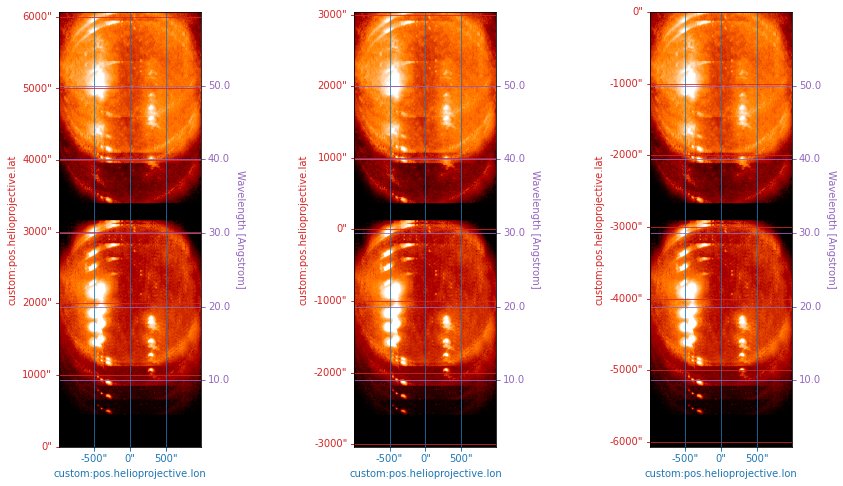
Creating the Overlappogram#
We can then flatten this to an overlappogram, specifying the roll angle (angle between the pixel and world axes, where 0 corresponds to the y-like pixel axis aligned with latitude) and spectral order.
[7]:
observer = get_earth()
[19]:
moxsi_overlap = construct_overlappogram(
    moxsi_cube,
    roll_angle=0*u.deg,
    dispersion_angle=0*u.deg,
    observer=observer,
    order=1,
    correlate_p12_with_wave=False
)
WARNING: target cannot be converted to ICRS, so will not be set on SpectralCoord [astropy.wcs.wcsapi.fitswcs]
WARNING: FITSFixedWarning: 'datfix' made the change 'Set MJD-OBS to 59649.660875 from DATE-OBS'. [astropy.wcs.wcs]
[20]:
moxsi_overlap.dimensions
[20]:
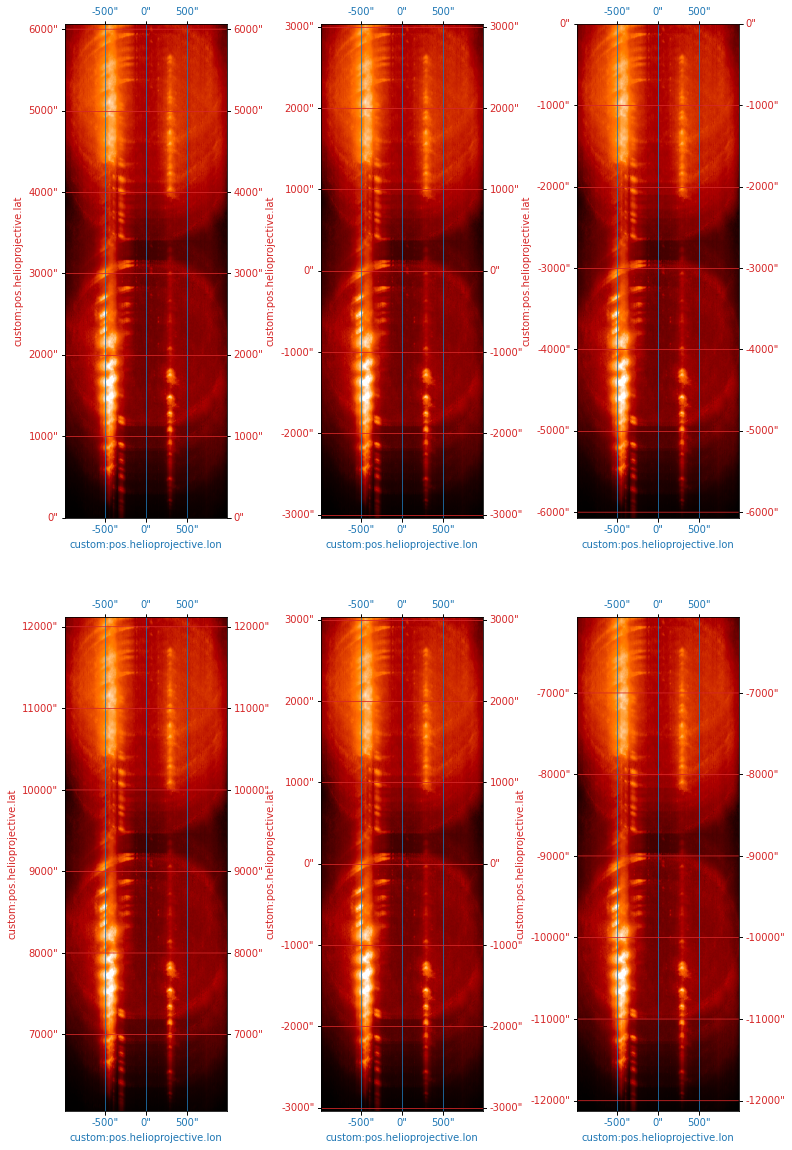
We can then plot the overlappogram at a few different “wavelength slices.” Note as we move in wavelength space, our latitude grid shifts along the dispersion axis.
[9]:
fig = plt.figure(figsize=(15,8))
wvl_indices = [0,1073//2,1072]
for i,iw in enumerate(wvl_indices):
    ax = fig.add_subplot(1,len(wvl_indices),i+1, projection=moxsi_overlap[iw].wcs)
    moxsi_overlap[iw].plot(axes=ax,**plot_props)
    _ = color_lat_lon_axes(ax,lat_tick_ops={'spacing':1000*u.arcsec})
    #ax.coords[2].set_format_unit(u.angstrom)
    #ax.coords[2].set_major_formatter('x.x')
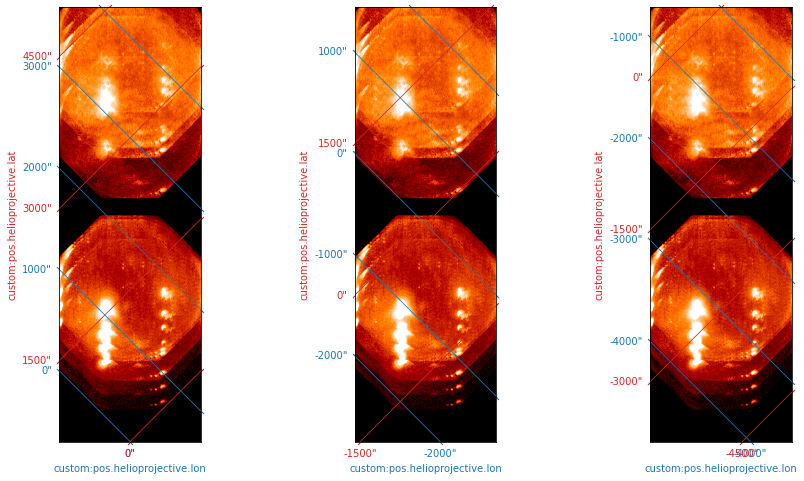
Varying Roll Angle#
We can also choose to orient the pixel (and thus the dispersion) axis at some non-zero angle relative to the world axes. This is equivalent to “rolling” our satellite.
[8]:
moxsi_overlap_r45 = construct_overlappogram(
    moxsi_cube,
    roll_angle=45*u.deg,
    observer=observer,
    order=1
)
WARNING: FITSFixedWarning: 'datfix' made the change 'Set MJD-OBS to 59649.660875 from DATE-OBS'. [astropy.wcs.wcs]
[9]:
fig = plt.figure(figsize=(15,8))
wvl_indices = [0,1073//2,1072]
for i,iw in enumerate(wvl_indices):
    ax = fig.add_subplot(1,len(wvl_indices),i+1, projection=moxsi_overlap_r45[iw].wcs)
    moxsi_overlap_r45[iw].plot(axes=ax,**plot_props)
    _ = color_lat_lon_axes(ax,
                           lon_tick_ops={'spacing':1000*u.arcsec},
                           lat_tick_ops={'spacing':1500*u.arcsec})
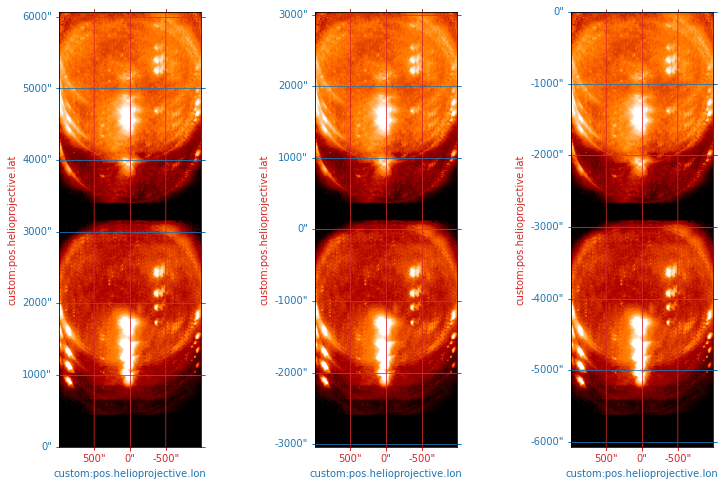
Or completely in the “longitude” direction
[12]:
moxsi_overlap_r90 = construct_overlappogram(
    moxsi_cube,
    roll_angle=90*u.deg,
    observer=observer,
    order=1
)
WARNING: target cannot be converted to ICRS, so will not be set on SpectralCoord [astropy.wcs.wcsapi.fitswcs]
WARNING: FITSFixedWarning: 'datfix' made the change 'Set MJD-OBS to 59646.624634 from DATE-OBS'. [astropy.wcs.wcs]
[13]:
fig = plt.figure(figsize=(13,8))
wvl_indices = [0,1073//2,1072]
for i,iw in enumerate(wvl_indices):
    ax = fig.add_subplot(1,len(wvl_indices),i+1, projection=moxsi_overlap_r90[iw].wcs)
    moxsi_overlap_r90[iw].plot(axes=ax,**plot_props)
    _ = color_lat_lon_axes(ax,lon_tick_ops={'spacing':1000*u.arcsec})
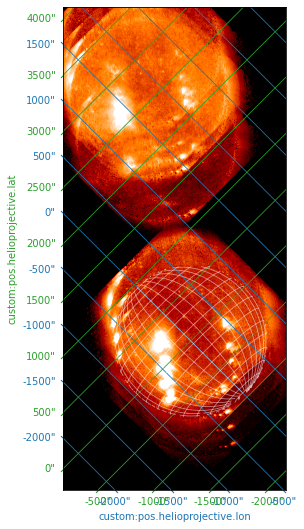
Varying Dispersion Angle#
We now want to investigate cases where our dispersion angle, the angle between the dispersion axis and the “long” pixel axis, is non-zero.
[134]:
moxsi_overlap_a0_d5 = construct_overlappogram(
    moxsi_cube,
    roll_angle=0*u.deg,
    dispersion_angle=5*u.deg,
    observer=observer,
    order=1,
    correlate_p12_with_wave=False,
)
WARNING: target cannot be converted to ICRS, so will not be set on SpectralCoord [astropy.wcs.wcsapi.fitswcs]
WARNING: FITSFixedWarning: 'datfix' made the change 'Set MJD-OBS to 59646.624634 from DATE-OBS'. [astropy.wcs.wcs]
[139]:
i_w = 0#iw_rank[0] + 600
fig = plt.figure(figsize=(4,12))
ax = fig.add_subplot(111, projection=moxsi_overlap_a0_d5[i_w].wcs)
moxsi_overlap_a0_d5[i_w].plot(axes=ax,**plot_props)
_ = color_lat_lon_axes(ax,lat_color='C2',
                       lon_tick_ops={'spacing':500*u.arcsec},
                       lat_tick_ops={'spacing':500*u.arcsec})
hgs_grid = draw_hgs_grid(ax, observer)

[137]:
moxsi_overlap_a45_d10 = construct_overlappogram(
    moxsi_cube,
    roll_angle=45*u.deg,
    dispersion_angle=10*u.deg,
    observer=observer,
    order=1,
    correlate_p12_with_wave=False,
)
WARNING: target cannot be converted to ICRS, so will not be set on SpectralCoord [astropy.wcs.wcsapi.fitswcs]
WARNING: FITSFixedWarning: 'datfix' made the change 'Set MJD-OBS to 59646.624634 from DATE-OBS'. [astropy.wcs.wcs]
[140]:
i_w = iw_rank[0]
fig = plt.figure(figsize=(4,12))
ax = fig.add_subplot(111, projection=moxsi_overlap_a45_d10[i_w].wcs)
moxsi_overlap_a45_d10[i_w].plot(axes=ax,**plot_props)
_ = color_lat_lon_axes(ax,lat_color='C2',
                       lon_tick_ops={'spacing':500*u.arcsec},
                       lat_tick_ops={'spacing':500*u.arcsec})
hgs_grid = draw_hgs_grid(ax, observer)
Varying Spectral Order#
[ ]:
m1 = construct_overlappogram(moxsi_cube,roll_angle=0*u.deg,order=1,observer=observer)
m3 = construct_overlappogram(moxsi_cube,roll_angle=0*u.deg,order=3,observer=observer)
WARNING: target cannot be converted to ICRS, so will not be set on SpectralCoord [astropy.wcs.wcsapi.fitswcs]
WARNING: FITSFixedWarning: 'datfix' made the change 'Set MJD-OBS to 59641.917173 from DATE-OBS'. [astropy.wcs.wcs]
[ ]:
fig = plt.figure(figsize=(13,20))
wvl_indices = [0,1073//2,1072]
for i,iw in enumerate(wvl_indices):
    ax = fig.add_subplot(2,len(wvl_indices),i+1, projection=m1[iw].wcs)
    m1[iw].plot(axes=ax,**plot_props)
    _ = color_lat_lon_axes(ax,lat_tick_ops={'spacing':1000*u.arcsec})
for i,iw in enumerate(wvl_indices):
    ax = fig.add_subplot(2,len(wvl_indices),len(wvl_indices)+i+1, projection=m3[iw].wcs)
    m3[iw].plot(axes=ax,**plot_props)
    _ = color_lat_lon_axes(ax,lat_tick_ops={'spacing':1000*u.arcsec})
Experimenting with FITS Serialization#
[102]:
hdu = astropy.io.fits.ImageHDU(
    data=moxsi_overlap_a45_d10[:1,...].data,
    header=moxsi_overlap_a45_d10.wcs.to_header(),
)
hdu.writeto('../data/overlap-test.fits', overwrite=True, output_verify='ignore')
[99]:
hdu.header
[99]:
XTENSION= 'IMAGE   '           / Image extension
BITPIX  =                  -64 / array data type
NAXIS   =                    3 / number of array dimensions
NAXIS1  =                  496
NAXIS2  =                 1073
NAXIS3  =                    1
PCOUNT  =                    0 / number of parameters
GCOUNT  =                    1 / number of groups
WCSAXES =                    3 / Number of coordinate axes
CRPIX1  =                248.5 / Pixel coordinate of reference point
CRPIX2  =                537.0 / Pixel coordinate of reference point
CRPIX3  =                537.0 / Pixel coordinate of reference point
PC1_1   =     0.70710678118655 / Coordinate transformation matrix element
PC1_2   =     0.70710678118655 / Coordinate transformation matrix element
PC1_3   =    -0.57357643635105 / Coordinate transformation matrix element
PC2_1   =    -0.70710678118655 / Coordinate transformation matrix element
PC2_2   =     0.70710678118655 / Coordinate transformation matrix element
PC2_3   =    -0.81915204428899 / Coordinate transformation matrix element
PC3_1   =    -0.17364817766693 / Coordinate transformation matrix element
PC3_2   =     0.98480775301221 / Coordinate transformation matrix element
PC3_3   =                  0.0 / Coordinate transformation matrix element
CDELT1  =   0.0015722222222222 / [deg] Coordinate increment at reference point
CDELT2  =   0.0015722222222222 / [deg] Coordinate increment at reference point
CDELT3  =  5.4999947547913E-12 / [m] Coordinate increment at reference point
CUNIT1  = 'deg'                / Units of coordinate increment and value
CUNIT2  = 'deg'                / Units of coordinate increment and value
CUNIT3  = 'm'                  / Units of coordinate increment and value
CTYPE1  = 'HPLN-TAN'           / Coordinate type codegnomonic projection
CTYPE2  = 'HPLT-TAN'           / Coordinate type codegnomonic projection
CTYPE3  = 'WAVE'               / Vacuum wavelength (linear)
CRVAL1  =                  0.0 / [deg] Coordinate value at reference point
CRVAL2  =                  0.0 / [deg] Coordinate value at reference point
CRVAL3  =  3.0479971885681E-09 / [m] Coordinate value at reference point
LONPOLE =                180.0 / [deg] Native longitude of celestial pole
LATPOLE =                  0.0 / [deg] Native latitude of celestial pole
MJDREF  =                  0.0 / [d] MJD of fiducial time
DATE-OBS= '2022-03-08T14:59:28.377' / ISO-8601 time of observation
MJD-OBS =      59646.624633993 / [d] MJD of observation
RSUN_REF=          695700000.0 / [m] Solar radius
DSUN_OBS=      148492379724.11 / [m] Distance from centre of Sun to observer
HGLN_OBS=                  0.0 / [deg] Stonyhurst heliographic lng of observer
HGLT_OBS=     -7.2478225290876 / [deg] Heliographic latitude of observer
[ ]:
with astropy.io.fits.open('../data/overlap-test.fits', mode='readonly') as hdul:
    print(len(hdul))
    hdul[1].header
2