[1]:
import sys

import numpy as np
import astropy.units as u
from ndcube import NDCube
import astropy.wcs
import distributed
import matplotlib
import matplotlib.pyplot as plt
from mpl_toolkits.axes_grid1 import make_axes_locatable
from astropy.visualization import ImageNormalize, LogStretch
import sunpy.map

from overlappy.reproject import reproject_to_overlappogram
from overlappy.util import color_lat_lon_axes, strided_array
from overlappy.io import read_overlappogram

sys.path.append('../../')
from mocksipipeline.util import read_data_cube
from mocksipipeline.detector.response import Channel, SpectrogramChannel, convolve_with_response
WARNING: SunpyDeprecationWarning: The `sunpy.io.fits` module is deprecated, as it was designed for internal use. Use the `astropy.fits.io` module instead for more generic functionality to read FITS files. [sunpy.io.fits]
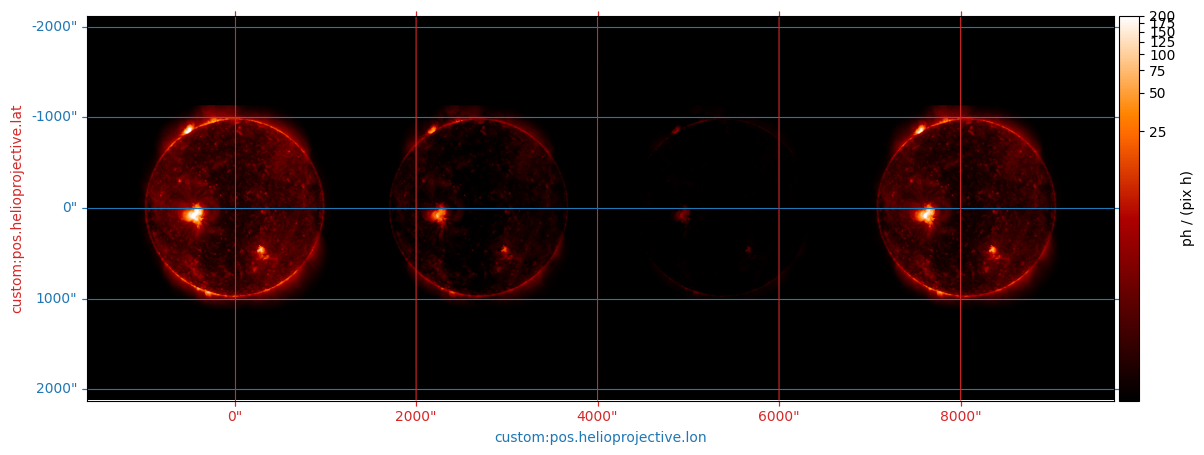
Pinhole Images#
Testing modeling of the pinhole images.
We should place these all on the same detector, i.e. we should reproject to the same array and adjust the reference pixel accordingly
[2]:
client = distributed.Client()
2022-09-15 13:18:43,062 - distributed.diskutils - INFO - Found stale lock file and directory '/var/folders/cr/pj7yk8p976d7ny98bgvlpfyr0000gq/T/dask-worker-space/worker-3xgd3mqt', purging
2022-09-15 13:18:43,063 - distributed.diskutils - INFO - Found stale lock file and directory '/var/folders/cr/pj7yk8p976d7ny98bgvlpfyr0000gq/T/dask-worker-space/worker-r8yyk7qt', purging
2022-09-15 13:18:43,063 - distributed.diskutils - INFO - Found stale lock file and directory '/var/folders/cr/pj7yk8p976d7ny98bgvlpfyr0000gq/T/dask-worker-space/worker-_r2i93zy', purging
2022-09-15 13:18:43,063 - distributed.diskutils - INFO - Found stale lock file and directory '/var/folders/cr/pj7yk8p976d7ny98bgvlpfyr0000gq/T/dask-worker-space/worker-0zcamurj', purging
2022-09-15 13:18:43,063 - distributed.diskutils - INFO - Found stale lock file and directory '/var/folders/cr/pj7yk8p976d7ny98bgvlpfyr0000gq/T/dask-worker-space/worker-l6lo3ubs', purging
[3]:
spectral_cube = read_data_cube('moxsi-spectral-cube-ar.fits', hdu=1)
[4]:
observer = astropy.wcs.utils.wcs_to_celestial_frame(spectral_cube.wcs).observer
[5]:
selected_filters = [
    'Be_thin',
    'Be_med',
    'Be_thick',
    'Al_poly',
]
chan_filename = '../../mocksipipeline/data/MOXSI_effarea.genx'
pinhole_channels = [Channel(f, chan_filename) for f in selected_filters]
[6]:
dispersed_orders = [SpectrogramChannel(o, chan_filename) for o in [0,1,3]]
[7]:
for ph in dispersed_orders + pinhole_channels:
    print('-----------')
    print(ph.name)
    print(f'Filter: {ph._data["filter_desc"]}')
    print(f'Grating: {ph._data["grating_desc"]}')
-----------
MOXSI_S0
Filter: 100 nm of Al based on conversation with Amir 11/11/20
Grating: zero order transmission of grating * polyimide, 11/11/20
-----------
MOXSI_S1
Filter: 100 nm of Al based on conversation with Amir 11/11/20
Grating: first order transmission of grating * polyimide, 11/11/20
-----------
MOXSI_S3
Filter: 100 nm of Al based on conversation with Amir 11/11/20
Grating: third order transmission of grating * polyimide, 11/11/20
-----------
Be_thin
Filter: 9 micron Be filter / XRT thin Be - no support
Grating: no grating
-----------
Be_med
Filter: 30 micron Be filter / XRT med Be - no support
Grating: no grating
-----------
Be_thick
Filter: 300 micron Be filter / XRT thick Be - no support
Grating: no grating
-----------
Al_poly
Filter: 1.25 micron Al filter * 2.5 micron Poly / XRT Al-Poly
Grating: no grating
[9]:
pinhole_window = 475
margin = 50
[ ]:
pinhole_images = {}
for i, ph in enumerate(pinhole_channels):
    ph_cube = convolve_with_response(spectral_cube, ph, include_gain=False)
    pinhole_images[ph.name] = reproject_to_overlappogram(
        ph_cube,
        ph.detector_shape,
        observer=observer,
        reference_pixel=(
            margin + pinhole_window*i + (pinhole_window + 1)/2,
            (ph.detector_shape[0] + 1)/2,
            1,
        )*u.pix,
        reference_coord=(
            0*u.arcsec,
            0*u.arcsec,
            ph_cube.axis_world_coords(0)[0].to('angstrom')[0],
        ),
        scale=(
            ph.resolution[0],
            ph.resolution[1],
            ph.spectral_resolution,
        ),
        roll_angle=-90*u.deg,
        dispersion_angle=0*u.deg,
        order=ph.spectral_order,
        meta_keys=['CHANNAME'],
        use_dask=True,
        sum_over_lambda=True,
        algorithm='interpolation'
    )
WARNING: UnitsWarning: The unit 'Angstrom' has been deprecated in the VOUnit standard. Suggested: 0.1nm. [astropy.units.format.utils]
WARNING: FITSFixedWarning: 'datfix' made the change 'Set MJD-OBS to 59162.750077 from DATE-OBS'. [astropy.wcs.wcs]
WARNING: No observer defined on WCS, SpectralCoord will be converted without any velocity frame change [astropy.wcs.wcsapi.fitswcs]
WARNING: No observer defined on WCS, SpectralCoord will be converted without any velocity frame change [astropy.wcs.wcsapi.fitswcs]
WARNING: No observer defined on WCS, SpectralCoord will be converted without any velocity frame change [astropy.wcs.wcsapi.fitswcs]
WARNING: No observer defined on WCS, SpectralCoord will be converted without any velocity frame change [astropy.wcs.wcsapi.fitswcs]
WARNING: No observer defined on WCS, SpectralCoord will be converted without any velocity frame change [astropy.wcs.wcsapi.fitswcs]
WARNING: UnitsWarning: The unit 'Angstrom' has been deprecated in the VOUnit standard. Suggested: 0.1nm. [astropy.units.format.utils]
WARNING: FITSFixedWarning: 'datfix' made the change 'Set MJD-OBS to 59162.750077 from DATE-OBS'. [astropy.wcs.wcs]
[12]:
def get_composite_pinhole_image(images, ref_key):
    return NDCube(np.array([images[k].data[0] for k in images]).sum(axis=0),
                  wcs=images[ref_key][0].wcs,
                  unit=images[ref_key].unit,
                  meta=images[ref_key].meta)
[13]:
all_pinholes = get_composite_pinhole_image(pinhole_images, 'Be_thin')
[14]:
fig = plt.figure(figsize=(15,5))
wave_index = 0
ax = fig.add_subplot(111, projection=all_pinholes.wcs)
plot_unit = 'ph / (pix h)'
#vmin, vmax = AsymmetricPercentileInterval(1,99.5).get_limits(
#    u.Quantity(total_overlap[wave_index].data, total_overlap.unit).to_value(plot_unit),
#)
all_pinholes.plot(
    axes=ax,
    cmap='hinodexrt',
    norm=ImageNormalize(vmin=1e-2, vmax=2e2, stretch=LogStretch()),
    data_unit=plot_unit
)
im = ax.get_images()[0]
divider = make_axes_locatable(ax)
cax = divider.append_axes('right', size='2%', pad=0.05, axes_class=matplotlib.axes.Axes)
cbar = fig.colorbar(im, cax=cax, orientation='vertical')
cax.yaxis.set_ticks_position("right")
cbar.set_label(f'{plot_unit}',)
color_lat_lon_axes(ax)
[14]:
(<astropy.visualization.wcsaxes.coordinate_helpers.CoordinateHelper at 0x13be7a2e0>,
 <astropy.visualization.wcsaxes.coordinate_helpers.CoordinateHelper at 0x13d9a04f0>)
[17]:
overlappogram_components = {
    -3: read_overlappogram('overlappogram-ar-photons-order=-3.fits'),
    -1: read_overlappogram('overlappogram-ar-photons-order=-1.fits'),
    0: read_overlappogram('overlappogram-ar-photons-order=0.fits'),
    1: read_overlappogram('overlappogram-ar-photons-order=1.fits'),
    3: read_overlappogram('overlappogram-ar-photons-order=3.fits'),
}
[18]:
def get_full_overlappogram(components, order):
    data = np.array([components[k].data[0] for k in components]).sum(axis=0)
    wcs = components[order].wcs
    data_strided = strided_array(data, components[order].data.shape[0])
    return NDCube(data_strided, wcs=wcs, unit=components[order].unit, meta=components[order].meta)
[19]:
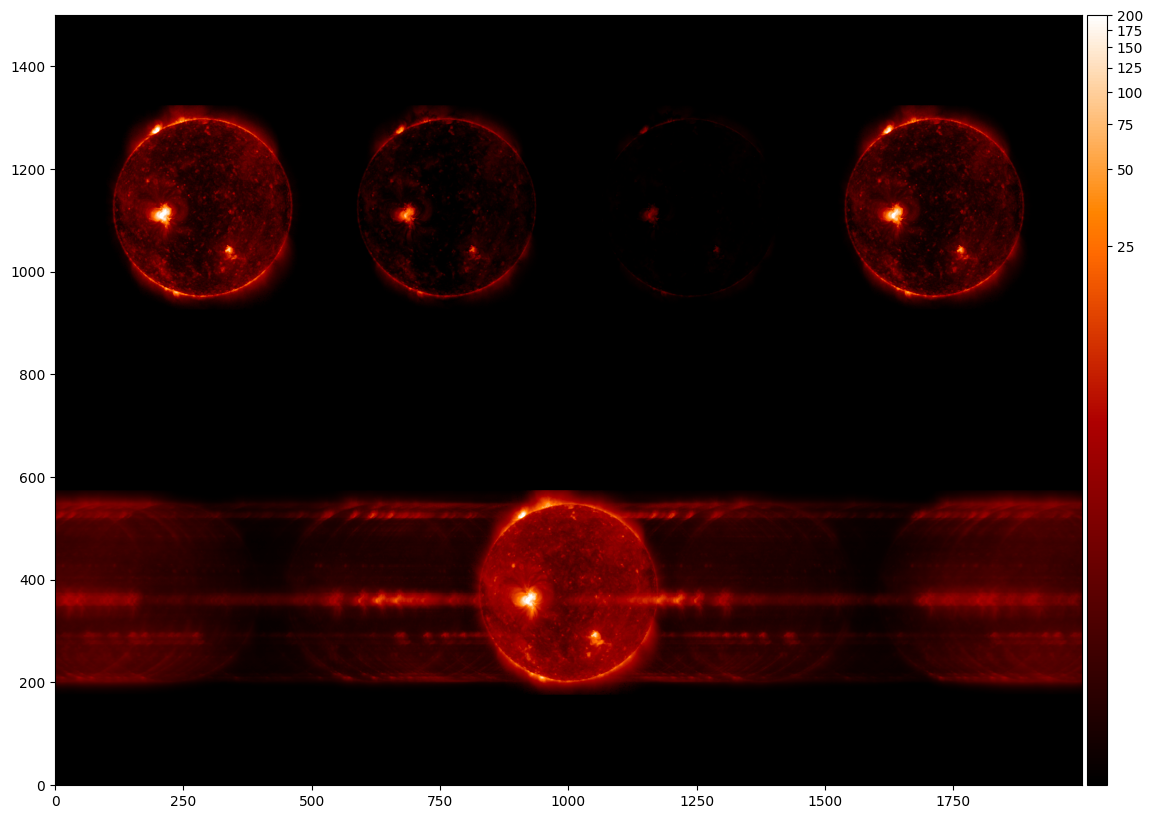
dispersed_image = get_full_overlappogram(overlappogram_components, 0)
[20]:
full_detector = np.vstack([dispersed_image[0].data,all_pinholes.data, ])
[21]:
fig = plt.figure(figsize=(18,10))
ax = fig.add_subplot(111)
im = ax.imshow((full_detector*dispersed_image.unit).to('ph / pix / h'),
           origin='lower',
           cmap='hinodexrt',
           norm=ImageNormalize(vmin=1e-2, vmax=2e2, stretch=LogStretch())
          )
divider = make_axes_locatable(ax)
cax = divider.append_axes('right', size='2%', pad=0.05, axes_class=matplotlib.axes.Axes)
cbar = fig.colorbar(im, cax=cax, orientation='vertical')
cax.yaxis.set_ticks_position("right")
WARNING: UnitsWarning: 'ph / pix / h' contains multiple slashes, which is discouraged by the FITS standard [astropy.units.format.generic]
[25]:
475*u.pix - (0.5*u.deg / pinhole_channels[0].resolution[0]).to('pix')
[25]:
$156.9788 \; \mathrm{pix}$
[ ]: